Model FLOPs Utilization: What Your GPUs Are Really Doing
GPU utilization tells you a GPU was busy. Model FLOPs Utilization (MFU) tells you how much of its compute went into the model. Here is what MFU is, what drags it down in training and in inference, and which of those causes can be fixed from the cluster.
Every GPU dashboard has a utilization number, and most teams treat it as the answer to "are we using what we paid for?" It isn't. That number says the GPU was busy. It says nothing about whether the work was useful, or how close the GPU came to what it can actually do.
There is a metric that does answer that question. It's called Model FLOPs Utilization, or MFU, and it's worth understanding even if you never put it on a dashboard, because the list of things that pull it down is a very good map of where GPU money goes.
---
What MFU is
A GPU has a peak rate of arithmetic it can perform, measured in floating-point operations per second (FLOPs). A model needs a known amount of arithmetic per token. MFU is the ratio between the two:
MFU = (tokens per second x FLOPs the model needs per token)
      -----------------------------------------------------
            peak FLOPs per second of the hardware
The FLOPs per token come from the model's size. A common approximation is about 2 x the parameter count for a forward pass, which is all inference does, and about 6 x the parameter count for a training step, which adds the backward pass.
The term comes from Google's 2022 PaLM paper, which reported 46.2% MFU for its training run. The same paper drew a distinction that still matters:
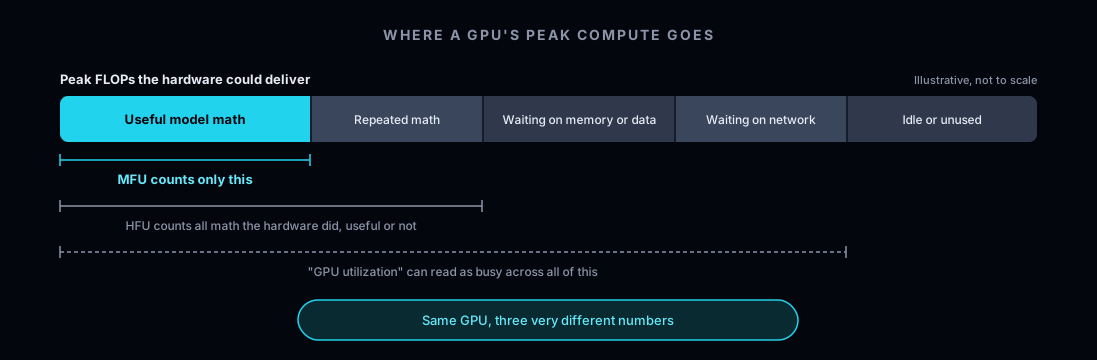
- MFU counts only the math the model needed.
- Hardware FLOPs Utilization (HFU) counts all the math the hardware did, including work that was repeated.
- GPU utilization, the number in most dashboards, counts the share of time anything at all was running.
---
A worked example
Take an 8-billion-parameter model serving traffic on a single H100, producing 2,500 tokens per second across all its requests.
- Math the model needed: 2 x 8 billion x 2,500 = 40 trillion FLOPs per second.
- What the GPU can do: roughly 1,000 trillion FLOPs per second of 16-bit math.
- MFU: about 4%.
The dashboard for that same GPU could easily read 90% utilization. Both numbers are true. They are answering different questions. (The figures here are rounded and illustrative.)
---
What "good" looks like depends on the job
In training, MFU is a target. Published large training runs commonly land between 30% and 50%. Nobody reaches 100%: some operations are limited by memory, and distributed training always spends time coordinating.
In inference, it's different in two ways.
First, generating text is limited by memory speed, not arithmetic. To produce each new token the GPU has to read through the model's weights, and it does comparatively little math while it does. Reading the prompt (prefill) is compute-heavy; generating the answer (decode) is not. Serving many requests at once helps, because one pass over the weights then produces many tokens.
Second, inference has a latency target. You leave headroom on purpose so a burst of traffic doesn't make users wait.
So for inference, a low MFU is not automatically waste, and the 4% above is not an emergency. MFU is a diagnostic there, not a goal. The goal is the lowest cost per token that still meets your latency target. What MFU gives you is the right question: of everything pulling this number down, which parts are physics, and which parts are a decision someone could change?
---
What pulls MFU down in training
Network and communication
- Gradient synchronization. As a job spreads across more GPUs, more time goes to keeping them in step, and the compute cores wait.
- Slow interconnects. Standard Ethernet where InfiniBand or RoCE is needed turns every synchronization into a bottleneck.
- Uneven topology. Routing hotspots in the data center delay some nodes, and the rest wait for them.
Memory and data
- Memory-bound operations. Normalization and activation layers do little math but touch a lot of memory.
- Slow data loading. If the CPU side can't prepare batches fast enough, the GPU sits idle between steps.
- Unoptimized attention. A plain attention implementation moves far more data through memory than a fused, memory-efficient one.
Parallelism
- Pipeline bubbles. Splitting a model into sequential stages leaves each stage idle at the start and end of every pass.
- Load imbalance. Uneven splits or mixed sequence lengths make fast GPUs wait for slow ones.
- Activation recomputation. Recomputing activations to save memory is repeated math: it raises HFU without raising MFU.
Software and shapes
- Unfused kernels. Many small operations launched separately cost overhead and extra memory round trips.
- Awkward dimensions. Sizes that aren't multiples of 8 can keep the GPU's tensor cores from engaging.
- Precision casting. Switching back and forth between number formats stalls the pipeline.
---
What pulls it down in inference
Some of the list above carries over. A model split across nodes still waits on the network, and the same kernel and shape issues apply inside the serving engine. But most of the loss in inference comes from decisions about what runs where.
- Deployments nobody is using. A model left running with no traffic has an MFU of zero and a full bill.
- More replicas than the traffic needs. Each replica gets a thin share of requests, so each GPU batches poorly.
- A model on a bigger GPU than it needs. The peak in the formula goes up and the useful math doesn't.
- Too few requests at once. A batch job that sends one request at a time, or a serving limit set too low, wastes the one thing that makes decode efficient.
- Saturation. A deployment pushed past its limits queues requests and evicts work in progress, which then has to be redone.
- Hardware faults. GPU errors and memory faults cause restarts and retries, all of which is work done twice.
- Flapping network links. For a model spread across nodes, an unstable link stalls every GPU in the group.
- Fragmentation. Free GPUs scattered across nodes can't be given to a job that needs several together, so they sit idle while that job waits.
- CPU bottlenecks. If tokenization and request handling can't keep up, the GPU is starved the same way a slow data loader starves training.
---
Which of these can be fixed from the cluster
The causes fall into two groups.
Some live inside the code: kernels, tensor shapes, the attention implementation, how a training job is parallelized. Those belong to the team that owns the training loop or the serving engine, and the tool for them is a profiler.
The rest live at the cluster level: which model is on which GPU, how many copies are running, what is idle, what is saturated, what is broken. Those are visible from telemetry and configuration the cluster already produces, and they are decisions, which means they can be changed.
That second group, for inference, is what Paralleliq works on.
| Cause | What Paralleliq recommends |
|---|---|
| Model on a larger GPU than it needs | A cheaper GPU tier the model fits |
| More replicas than traffic needs | Scaling in, or lowering the replica floor |
| Deployment nobody is using | Shutting it down or scaling it to zero |
| Saturated deployment | A larger tier or more GPUs per replica |
| Free GPUs that can't be used together | Consolidating workloads to free a contiguous block |
| GPU hardware faults | Draining the affected GPU, with the workloads it touches |
| Unstable network link on a multi-node model | Moving the workload off the affected link |
Checks for batch inference jobs, covering jobs on oversized GPUs and jobs that send too few requests at once, are in development.
Two things worth being plain about. Paralleliq does not hand you an MFU number, and it does not profile training code; the training-side causes above are yours to chase with a profiler. What it does is take the cluster-level causes, name the specific change for each one, and put it in front of an operator. Nothing is applied until someone approves it, and every decision is recorded.
---
The takeaway
GPU utilization tells you the lights were on. MFU tells you how much work got done. You don't need to compute MFU to benefit from it: the useful part is the list of causes, and the habit of asking which of them are physics and which are choices.
In inference, a surprising share are choices. A model on the wrong GPU, a replica nobody needs, a deployment someone forgot: none of these show up as a problem on a utilization chart, and all of them are fixable this week.
Want to see which of these apply to your own cluster? piqc is our free, open-source scanner. It runs read-only against a Kubernetes cluster and shows you what's deployed, on what hardware, and where capacity is being left on the table. Or request a demo to see how Paralleliq turns those findings into specific, approved changes.