The Router Solved Your Token Bill. Your GPU Fleet Didn't Get the Memo.
Enterprises are routing simple queries to cheap models and hard ones to heavy reasoning models to cut token costs. Nobody budgeted for what that does to the GPU fleet underneath — until the KV cache runs out at 2pm on a Tuesday.
A friend of mine works at a company that, a few months ago, quietly changed the rules on its engineers. Nothing dramatic — just a Slack message from platform engineering: simple questions go to the fast, cheap endpoint. Anything that smells like deep reasoning, multi-step analysis, or actual scientific work gets routed to the expensive model, and only that.
He wasn't thrilled about it. "I have to guess in advance how hard my question is going to be," he said, "and if I guess wrong, I either get a shallow answer or I've burned the good model on something trivial." It sounded, to him, like a policy someone in finance had come up with to save money. He wasn't wrong about the motive. He was wrong about who actually feels the consequences of it — and it isn't the engineers typing prompts.
It's whoever owns the GPU fleet underneath.
---
The New Blueprint for Enterprise AI
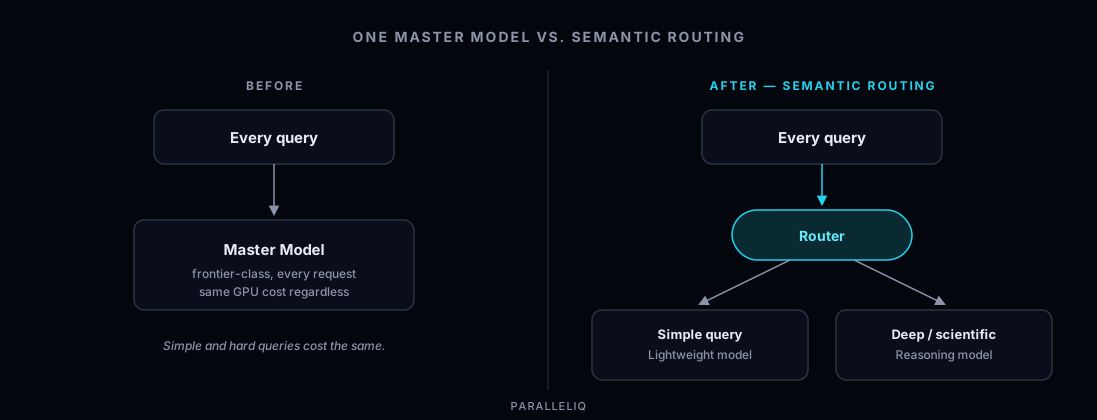
What my friend described has a name: semantic routing. Instead of sending every query through one "master model" regardless of how hard the question is, router middleware inspects each prompt and sends it to the cheapest model that can actually handle it — a lightweight model for a quick lookup, a heavy reasoning model or MoE setup for something that requires real multi-step thought.
On paper, this is obviously correct. Why pay reasoning-model prices for "what's the capital of France"? Enterprises adopting semantic routing are responding to two pressures at once: GPU capacity is scarce and expensive, and the token bill for running everything through a frontier model doesn't scale with how most queries actually look. Splitting traffic by difficulty is a legitimate, sensible cost lever.
It's also where most of the planning stops. The router gets designed, tuned, and shipped as a front-end concern — a routing table, some classification logic, a cost dashboard that shows the savings. Nobody budgets time for what it does to the infrastructure behind it, because from the front end, it looks like the same GPU fleet just serving traffic more cleverly.
It isn't the same fleet. It's a fleet now running two (or five, or ten) completely different resource profiles, and nothing downstream was built to notice.
---
Where the Strategy Breaks
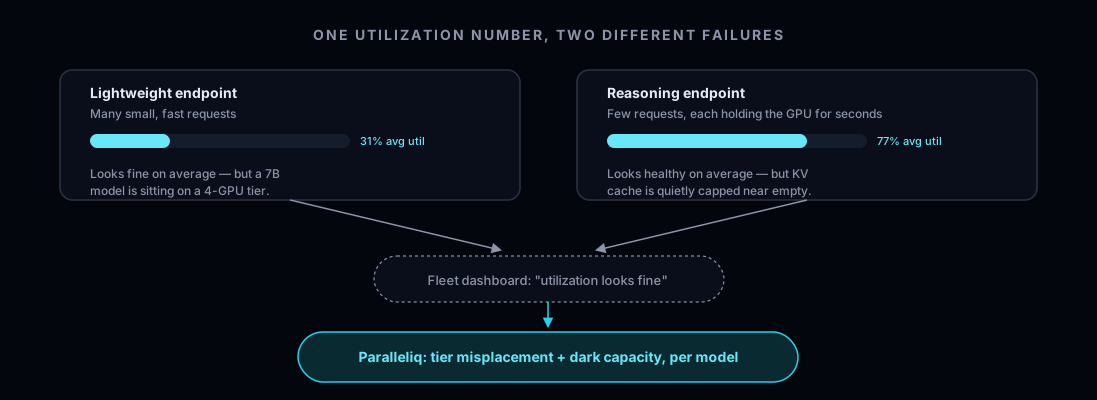
Traditional infrastructure autoscales against smooth, aggregate signals — requests per second, average CPU, average GPU utilization. That works when the fleet is running one kind of workload, because "60% utilized" means roughly the same thing every time. Routing traffic by difficulty breaks that assumption structurally, not occasionally, because it hands the fleet two fundamentally different bottlenecks and expects the same dashboard to catch both.
The lightweight tier is a throughput problem. A model like Llama-3-8B has a small structural footprint — once it's loaded into VRAM, it's built for raw speed. A traffic spike here shows up as a high volume of requests per second. That's a linear problem, and it's exactly what traditional autoscaling was built to handle: watch utilization, spin up another instance, let continuous batching absorb the load.
The heavy reasoning tier is a memory-starvation problem. A large model or MoE architecture needs a massive static VRAM footprint just to sit idle. When a spike hits this tier, it doesn't show up as high RPS — it shows up as pressure on the KV cache, the slice of GPU memory that holds the running context while the model works through a multi-step answer. Because a reasoning model can hold that memory for seconds or minutes per request, the cache fills up fast, and Time-to-First-Token starts climbing long before compute utilization looks unusual.
That's the infrastructure blind spot: if your orchestration layer waits for GPU compute utilization to hit 90% before reacting, you're already too late on the reasoning tier — the system chokes on cache pressure or throws an out-of-memory error first. And spinning up a new node for a heavy model isn't instant either; pulling a large container image and warming the cache can take minutes, which makes purely reactive autoscaling nearly useless against a spike that's already arrived. The infrastructure team is left choosing between two bad defaults: over-provision the expensive tier permanently, just in case (creating exactly the idle, "dark" capacity everyone was trying to avoid by routing in the first place), or run it lean and find out about the cache ceiling when requests start failing.
Either way, the savings the router was supposed to produce get spent somewhere else — just further down the stack, where it's harder to see and easier to blame on "GPU scarcity" instead of the actual cause.
---
The Missing Layer: Model-Aware Fleet Telemetry
This is a category error, not a tuning problem. You cannot manage a multi-model resource-scheduling problem with tools built to watch one model's worth of hardware metrics. The fix isn't a smarter router — routers are doing their job. It's giving the infrastructure layer the same thing the router already has: awareness of which model is generating a given signal, not just the signal itself. Think of it as the factory floor manager for a plant the router just turned into a multi-product line — someone has to know which machine is actually running which job before "utilization" means anything.
A single Prometheus alert on KV cache percentage gets you partway there, for one model, on one day. What it doesn't give you is a GPU tier and cost catalog that actually knows what a 70B reasoning model needs versus what it's currently sitting on; a check that keeps re-running automatically as routing weights shift and new models get added behind the router; or evidence and an audit trail attached to every recommendation so an operator can approve, decline, or justify the call later. Semantic routing doesn't create one threshold to tune — it creates a per-model sizing decision that has to stay correct indefinitely, for every model behind the router, forever. That's the part that doesn't scale by hand.
That's the layer Paralleliq operates at. Instead of a generic utilization number, it tracks live KV cache pressure, request queue depth, and Time-to-First-Token per model and per endpoint — so a drop in utilization on your lightweight tier and rising cache pressure on your reasoning tier are correctly read as two different situations, because they are. Because it understands why a reasoning endpoint's memory fills up the way it does, it can flag that an endpoint is heading toward cache saturation while there's still time for a person to act — before compute utilization would have shown anything unusual, and well before the cold-start minutes it takes to bring a new heavy-model node online.
Two findings fall directly out of that visibility, and both map to real, shipped detection rules, not a roadmap slide:
Tier misplacement. A model landed on hardware sized for a different job than the one it's actually doing — a reasoning-tier GPU serving a workload that would fit comfortably on a cheaper card, or the reverse, a model straining against a ceiling it was never sized for. In a single-model fleet this is a one-time sizing decision someone gets right or wrong once. Behind a semantic router, it's a decision that needs re-checking per model, continuously, as routing rules and traffic mix shift.
Idle, dark capacity. The GPU-hours a team keeps on standby specifically to absorb the next reasoning-model spike, sitting unused the rest of the time because nobody wants to be the one who under-provisioned right before a demo. That capacity is real spend, and it's exactly the kind of thing a model-aware system can surface as a specific, dollar-quantified finding instead of an assumption baked permanently into the cluster's size.
Here's what that looks like in practice — an illustrative example, not an actual customer result:
Finding: Tier misplacement — reasoning endpoint over-provisioned
Workload: llama-3-70b-reasoning · 4x H100 · prod-inference

Evidence (7-day window):
  Avg GPU utilization        12%
  Avg KV cache usage         18%
  Request queue backlog      0%
  Request swaps              0

Recommendation: Downgrade to 2x A100 — static footprint fits
comfortably within the smaller tier's memory budget.
Estimated savings: ~$69,000/year

[ Approve ]  [ Decline: reserved for planned traffic increase ]  [ Request more evidence ]
That's the pattern for both findings: a recommendation with the evidence attached, not an automatic change — an operator looks at it and approves, declines, or asks for more evidence, the same governance model as everywhere else in the platform. Paralleliq doesn't silently shift workloads on its own; it makes sure the person who can is looking at the right signal, with the right evidence, early enough to act on it — continuously, per model, without anyone having to remember to look. Multi-model chaos on the front end doesn't have to mean opaque, ad hoc firefighting on the back end.
---
The Takeaway
The future of enterprise AI isn't one giant model handling everything — it's an ecosystem of specialized models, routed by difficulty, cost, and capability. That shift is already happening, and it's the right call for anyone paying a token bill. But a smarter front end deserves an infrastructure layer that's just as deliberate, not one still reading the fleet the way it would read a single-model deployment from two years ago.
If your team adopted a router to control cost, it's worth checking whether those savings are actually landing — or quietly being re-spent on GPU capacity nobody's watching closely enough to notice.
Want to see what your own multi-model fleet looks like from the hardware side? piqc is our free, open-source scanner — point it at a cluster and get an instant read on tier misplacement and idle capacity, no signup required. Or request a demo to see how Paralleliq handles it continuously, across every model behind your router.